Admissions Statistics
Freshman Admissions
| 2016 | 2017 | 2018 | 2019 | 2020 | 2021 | 2022 | 2023 | 2024 | 2025 | |
|---|---|---|---|---|---|---|---|---|---|---|
| Applied | 7,263 | 7,737 | 8,210 | 7,965 | 8,926 | 9,614 | 9,163 | 8,954 | 9,165 | 9,140 |
| Admitted | 5,886 | 6,282 | 6,771 | 6,675 | 7,429 | 8,468 | 8,821 | 8,624 | 8,732 | 8,561 |
| % Admitted | 81% | 81% | 82% | 84% | 83% | 88% | 96% | 96% | 95% | 94% |
| FT Enrolled | 1,568 | 1,565 | 1,561 | 1,675 | 1,586 | 1,827 | 1,910 | 1,662 | 1,539 | 1,780 |
| % Yield | 27% | 25% | 23% | 25% | 21% | 22% | 22% | 19% | 18% | 21% |
Freshman Academic Profile
Incoming Freshman Scores and High School Rank
Average Test Scores
| 2016 | 2017* | 2018 | 2019 | 2020 | 2021 | 2022 | 2023 | 2024 | 2025 | |
|---|---|---|---|---|---|---|---|---|---|---|
| ACT | 26 | 26 | 27 | 26 | 26 | 27 | 27 | 27 | 27 | 27 |
| SAT | 1145 | 1221 | 1211 | 1221 | 1211 | 1242 | 1238 | 1241 | 1246 | 1255 |
*Redesigned SAT scores begin 2017
High School Rank
| 2016 | 2017 | 2018 | 2019 | 2020 | 2021 | 2022 | 2023 | 2024 | 2025 | |
|---|---|---|---|---|---|---|---|---|---|---|
| Top 10% of High School Class | 29% | 27% | 30% | 32% | 29% | 30% | 27% | 30% | 28% | 37% |
| Top 25% of High School Class | 60% | 56% | 59% | 61% | 61% | 59% | 58% | 55% | 55% | 64% |
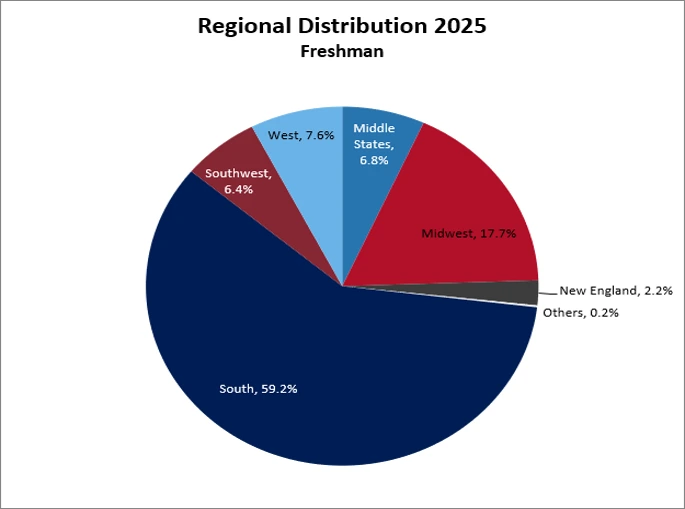
Regional Distribution: Freshman 2024
| New England | |
|---|---|
| Connecticut | 9 |
| Maine | 3 |
| Massachusetts | 14 |
| New Hampshire | 4 |
| Rhode Island | 5 |
| Vermont | 4 |
| Total Number within Region | 39 |
| Percent within Region | 2.2% |
| Midwest | |
|---|---|
| Illinois | 88 |
| Indiana | 55 |
| Iowa | 6 |
| Kansas | 11 |
| Michigan | 14 |
| Minnesota | 22 |
| Missouri | 38 |
| Nebraska | 1 |
| North Dakota | 2 |
| Ohio | 42 |
| South Dakota | 2 |
| West Virginia | 2 |
| Wisconsin | 26 |
| Total Number within Region | 309 |
| Percent within Region | 17.7% |
| South | |
|---|---|
| Alabama | 29 |
| Florida | 58 |
| Georgia | 51 |
| Kentucky | 35 |
| Louisiana | 11 |
| Mississippi | 6 |
| North Carolina | 37 |
| South Carolina | 21 |
| Tennessee | 756 |
| Virginia | 30 |
| Total Number within Region | 1034 |
| Percent within Region | 59.2% |
| Middle States | |
|---|---|
| Delaware | 3 |
| Dist of Columbia | 0 |
| Maryland | 21 |
| New Jersey | 31 |
| New York | 27 |
| Pennsylvania | 37 |
| Total Number within Region | 119 |
| Percent within Region | 6.8% |
| West | |
|---|---|
| Alaska | 1 |
| Arizona | 8 |
| California | 60 |
| Colorado | 27 |
| Hawaii | 0 |
| Idaho | 3 |
| Montana | 3 |
| Nevada | 3 |
| Oregon | 8 |
| Utah | 3 |
| Washington | 16 |
| Wyoming | 1 |
| Total Number within Region | 133 |
| Percent within Region | 7.6% |
| Southwest | |
|---|---|
| Arkansas | 8 |
| New Mexico | 0 |
| Oklahoma | 4 |
| Texas | 99 |
| Total Number within Region | 111 |
| Percent within Region | 6.4% |
| Other | |
|---|---|
| U.S. Territories | 0 |
| International | 3 |
| Unspecified or Living Abroad | 0 |
| Total Number within Other Regions | 3 |
| Percent within Other Regions | 0.2% |
| Total Freshman | 1,748 |
Includes full-time new freshman