
All Student Enrollment
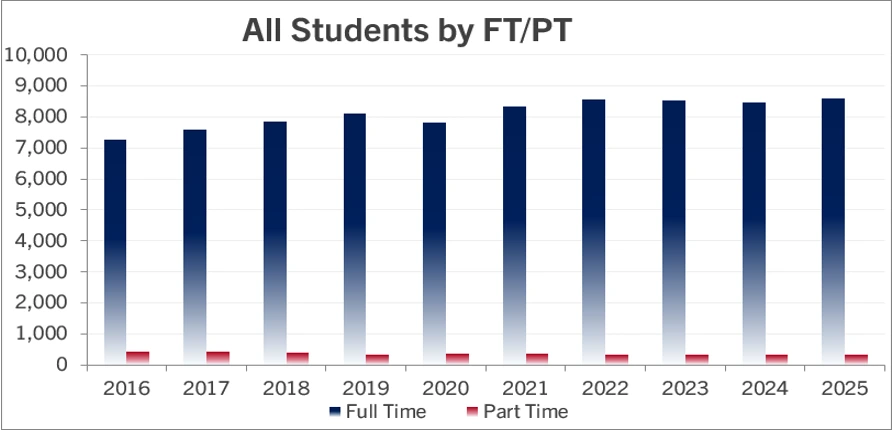
| Full-Time | ||||||||||
|---|---|---|---|---|---|---|---|---|---|---|
| Year | 2016 | 2017 | 2018 | 2019 | 2020 | 2021 | 2022 | 2023 | 2024 | 2025 |
| Number | 7,282 | 7,587 | 7,851 | 8,098 | 7,825 | 8,345 | 8,562 | 8,532 | 8,475 | 8,612 |
| % Change | 6% | 4% | 3% | 3% | -3% | 7% | 3% | -0.4% | -0.7% | 1.6% |
| Part-Time | ||||||||||
|---|---|---|---|---|---|---|---|---|---|---|
| Year | 2016 | 2017 | 2018 | 2019 | 2020 | 2021 | 2022 | 2023 | 2024 | 2025 |
| Number | 441 | 425 | 409 | 342 | 379 | 351 | 348 | 340 | 328 | 320 |
| % Change | -6% | -4% | -4% | -16% | 11% | -7% | -1% | -2% | -4% | -2% |
| Total Headcount | ||||||||||
|---|---|---|---|---|---|---|---|---|---|---|
| Year | 2016 | 2017 | 2018 | 2019 | 2020 | 2021 | 2022 | 2023 | 2024 | 2025 |
| Number | 7,723 | 8,012 | 8,260 | 8,440 | 8,204 | 8,696 | 8,910 | 8,872 | 8,803 | 8,932 |
| % Change | 5% | 4% | 3% | 2% | -3% | 6% | 2% | -0.4 | -0.8% | 1.5% |
| Full-Time Equivalent (FTE) | ||||||||||
|---|---|---|---|---|---|---|---|---|---|---|
| Year | 2016 | 2017 | 2018 | 2019 | 2020 | 2021 | 2022 | 2023 | 2024 | 2025 |
| Number | 7,429 | 7,729 | 7,987 | 8,212 | 7,951 | 8,462 | 8,678 | 8,645 | 8,584 | 8,719 |
| % Change | 6% | 4% | 3% | 3% | -3% | 6% | 3% | -0.4% | -0.7% | 1.6% |
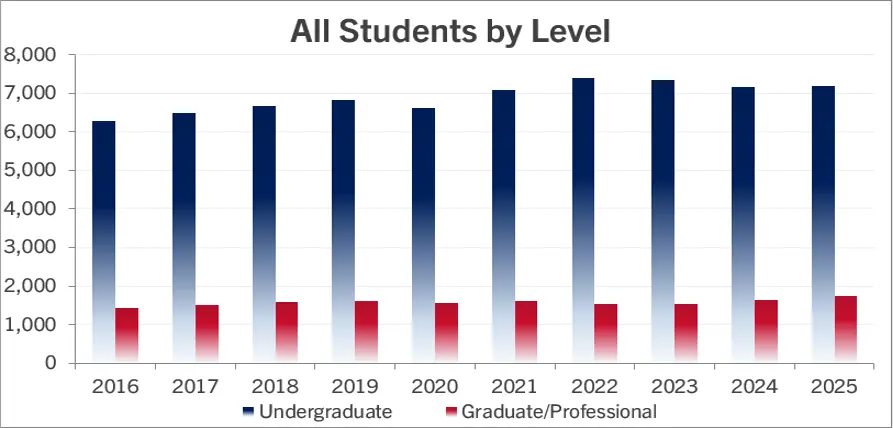
| Undergraduate | ||||||||||
|---|---|---|---|---|---|---|---|---|---|---|
| Year | 2016 | 2017 | 2018 | 2019 | 2020 | 2021 | 2022 | 2023 | 2024 | 2025 |
| Number | 6,293 | 6,497 | 6,666 | 6,820 | 6,631 | 7,076 | 7,384 | 7,338 | 7,175 | 7,184 |
| % Change | 5% | 3% | 3% | 2% | -3% | 7% | 4% | -1% | -2% | 0.1% |
| Graduate/Professional | ||||||||||
|---|---|---|---|---|---|---|---|---|---|---|
| Year | 2016 | 2017 | 2018 | 2019 | 2020 | 2021 | 2022 | 2023 | 2024 | 2025 |
| Number | 1,430 | 1,515 | 1,594 | 1,620 | 1,573 | 1,620 | 1,526 | 1,534 | 1,628 | 1,748 |
| % Change | 5% | 6% | 5% | 2% | -3% | 3% | -6% | 1% | 6% | 7% |
| Total Enrollment | ||||||||||
|---|---|---|---|---|---|---|---|---|---|---|
| Year | 2016 | 2017 | 2018 | 2019 | 2020 | 2021 | 2022 | 2023 | 2024 | 2025 |
| Number | 7,723 | 8,012 | 8,260 | 8,440 | 8,204 | 8,696 | 8,910 | 8,872 | 8,803 | 8,932 |
| % Change | 5% | 4% | 3% | 2% | -3% | 6% | 2% | -0.4% | -0.8% | 1.5% |
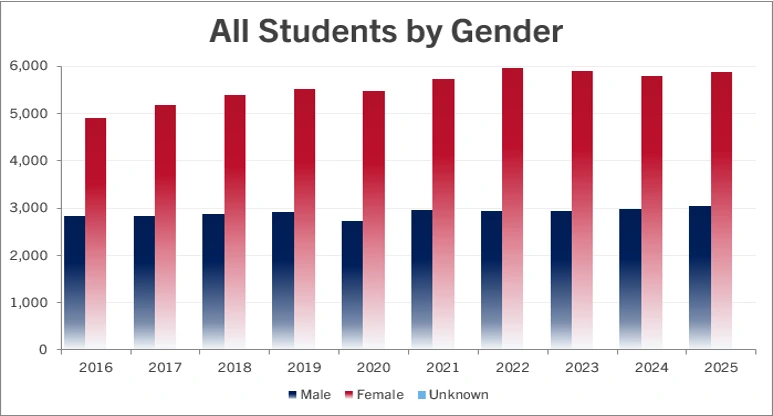
| Male | ||||||||||
|---|---|---|---|---|---|---|---|---|---|---|
| Year | 2016 | 2017 | 2018 | 2019 | 2020 | 2021 | 2022 | 2023 | 2024 | 2025 |
| Number | 2,825 | 2,836 | 2,870 | 2,924 | 2,727 | 2,965 | 2,935 | 2,947 | 2,987 | 3,033 |
| % of Total | 37% | 35% | 35% | 34.6% | 33.2% | 34.1% | 32.9% | 33.2% | 33.9% | 34.0% |
| Female | ||||||||||
|---|---|---|---|---|---|---|---|---|---|---|
| Year | 2016 | 2017 | 2018 | 2019 | 2020 | 2021 | 2022 | 2023 | 2024 | 2025 |
| Number | 4,898 | 5,176 | 5,390 | 5,516 | 5,477 | 5,731 | 5,968 | 5,904 | 5,794 | 5,876 |
| % of Total | 63% | 65% | 65% | 65.4% | 66.8% | 65.9% | 66.9% | 66.5% | 65.8% | 65.8% |
| *Unknown | ||||||||||
|---|---|---|---|---|---|---|---|---|---|---|
| Year | 2016 | 2017 | 2018 | 2019 | 2020 | 2021 | 2022 | 2023 | 2024 | 2025 |
| Number | 7 | 21 | 22 | 23 | ||||||
| % of Total | 0.1% | 0.2% | 0.2% | 0.3% | ||||||
| Total | ||||||||||
|---|---|---|---|---|---|---|---|---|---|---|
| Year | 2016 | 2017 | 2018 | 2019 | 2020 | 2021 | 2022 | 2023 | 2024 | 2025 |
| Number | 7,723 | 8,012 | 8,260 | 8,440 | 8,204 | 8,696 | 8,910 | 8,872 | 8,803 | 8,932 |
*Beginning with Fall 2022, IPEDS allows students to be reported as gender unknown.
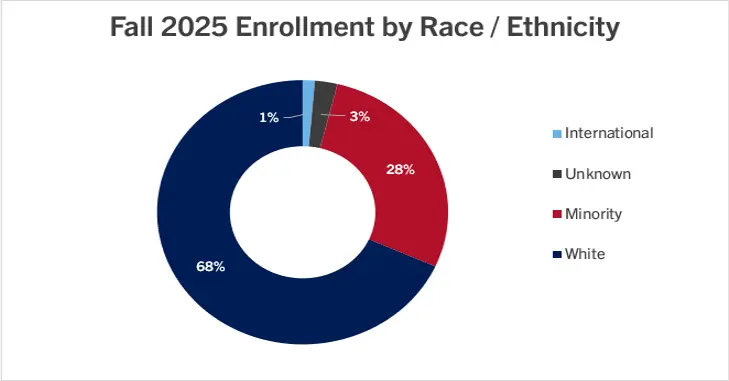
| US Non-Resident | ||||||||||
|---|---|---|---|---|---|---|---|---|---|---|
| Year | 2016 | 2017 | 2018 | 2019 | 2020 | 2021 | 2022 | 2023 | 2024 | 2025 |
| Number | 94 | 108 | 99 | 84 | 59 | 74 | 84 | 94 | 94 | 121 |
| % of Total | 1.2% | 1.3% | 1.2% | 1.0% | 0.7% | 0.9% | 0.9% | 1.1% | 1.1% | 1.4% |
| Hispanic | ||||||||||
|---|---|---|---|---|---|---|---|---|---|---|
| Year | 2016 | 2017 | 2018 | 2019 | 2020 | 2021 | 2022 | 2023 | 2024 | 2025 |
| Number | 341 | 389 | 450 | 497 | 536 | 616 | 716 | 797 | 861 | 944 |
| % of Total | 4.4% | 4.9% | 5.4% | 5.9% | 6.5% | 7.1% | 8.0% | 9.0% | 9.8% | 10.6% |
| Black or African American, non-Hispanic | ||||||||||
|---|---|---|---|---|---|---|---|---|---|---|
| Year | 2016 | 2017 | 2018 | 2019 | 2020 | 2021 | 2022 | 2023 | 2024 | 2025 |
| Number | 383 | 417 | 429 | 456 | 433 | 481 | 478 | 510 | 579 | 676 |
| % of Total | 5.0% | 5.2% | 5.2% | 5.4% | 5.3% | 5.5% | 5.4% | 5.7% | 6.6% | 7.6% |
| White, non-Hispanic | ||||||||||
|---|---|---|---|---|---|---|---|---|---|---|
| Year | 2016 | 2017 | 2018 | 2019 | 2020 | 2021 | 2022 | 2023 | 2024 | 2025 |
| Number | 6,082 | 6,385 | 6,581 | 6,707 | 6,476 | 6,808 | 6,848 | 6,645 | 6,349 | 6,098 |
| % of Total | 78.8% | 79.7% | 79.7% | 79.5% | 78.9% | 78.3% | 76.9% | 74.9% | 72.1% | 68.3% |
| American Indian or Alaska Native, non-Hispanic | ||||||||||
|---|---|---|---|---|---|---|---|---|---|---|
| Year | 2016 | 2017 | 2018 | 2019 | 2020 | 2021 | 2022 | 2023 | 2024 | 2025 |
| Number | 22 | 20 | 26 | 25 | 21 | 19 | 22 | 26 | 27 | 16 |
| % of Total | 0.3% | 0.2% | 0.3% | 0.3% | 0.3% | 0.2% | 0.2% | 0.3% | 0.3% | 0.2% |
| Asian, non-Hispanic | ||||||||||
|---|---|---|---|---|---|---|---|---|---|---|
| Year | 2016 | 2017 | 2018 | 2019 | 2020 | 2021 | 2022 | 2023 | 2024 | 2025 |
| Number | 237 | 213 | 201 | 207 | 223 | 231 | 267 | 288 | 298 | 335 |
| % of Total | 3.1% | 2.7% | 2.4% | 2.5% | 2.7% | 2.7% | 3.0% | 3.2% | 3.4% | 3.8% |
| Native Hawaiian or other Pacific Islander, non-Hispanic | ||||||||||
|---|---|---|---|---|---|---|---|---|---|---|
| Year | 2016 | 2017 | 2018 | 2019 | 2020 | 2021 | 2022 | 2023 | 2024 | 2025 |
| Number | 7 | 6 | 8 | 8 | 9 | 8 | 8 | 8 | 8 | 6 |
| % of Total | 0.1% | 0.1% | 0.1% | 0.1% | 0.1% | 0.1% | 0.1% | 0.1% | 0.1% | 0.1% |
| Two or more races, non-Hispanic | ||||||||||
|---|---|---|---|---|---|---|---|---|---|---|
| Year | 2016 | 2017 | 2018 | 2019 | 2020 | 2021 | 2022 | 2023 | 2024 | 2025 |
| Number | 247 | 275 | 300 | 330 | 309 | 347 | 371 | 380 | 453 | 512 |
| % of Total | 3.2% | 3.4% | 3.6% | 3.9% | 3.8% | 4.0% | 4.2% | 4.3% | 5.1% | 5.7% |
| Race and/or ethnicity unknown | ||||||||||
|---|---|---|---|---|---|---|---|---|---|---|
| Year | 2016 | 2017 | 2018 | 2019 | 2020 | 2021 | 2022 | 2023 | 2024 | 2025 |
| Number | 310 | 199 | 166 | 126 | 138 | 112 | 116 | 124 | 134 | 224 |
| % of Total | 4.0% | 2.5% | 2.0% | 1.5% | 1.7% | 1.3% | 1.3% | 1.4% | 1.5% | 2.5% |
| Total | ||||||||||
|---|---|---|---|---|---|---|---|---|---|---|
| Year | 2016 | 2017 | 2018 | 2019 | 2020 | 2021 | 2022 | 2023 | 2024 | 2025 |
| % of Total | 7,723 | 8,012 | 8,260 | 8,440 | 8,204 | 8,696 | 8,910 | 8,872 | 8,803 | 8,932 |
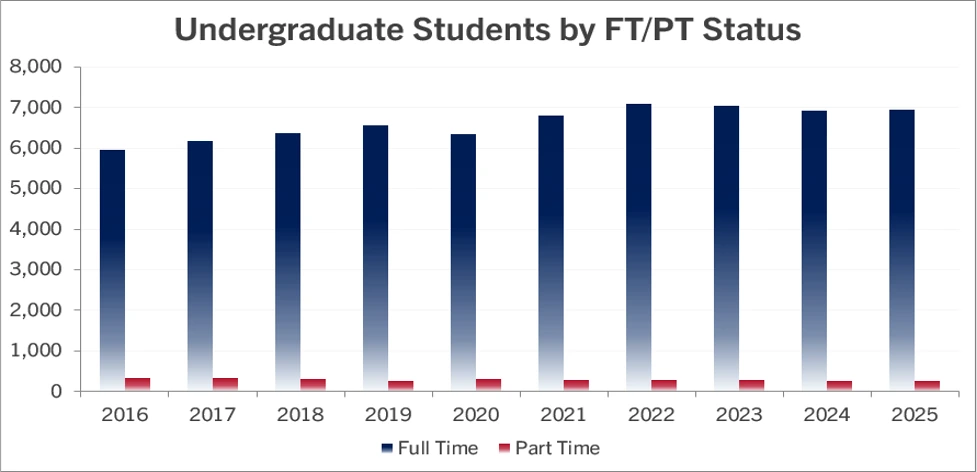
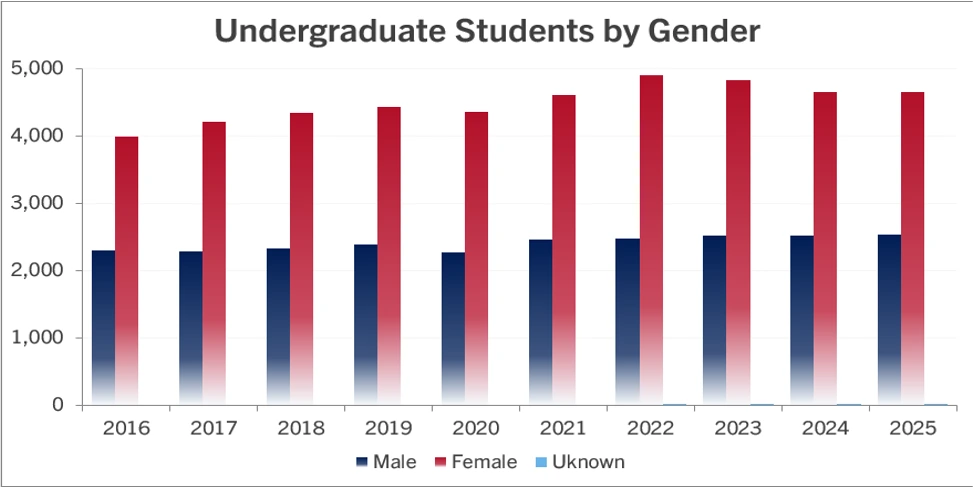
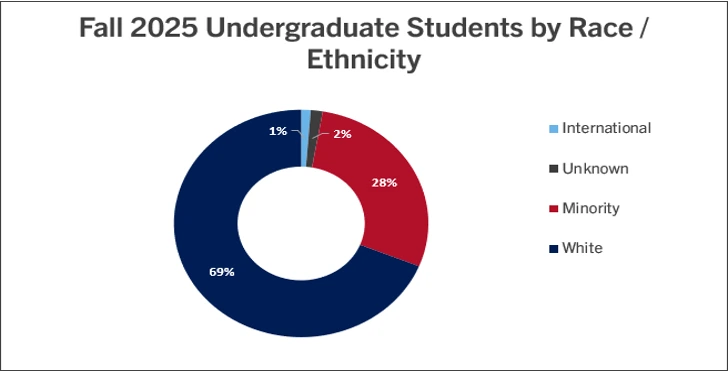
Undergraduate Enrollment
| Full-Time | ||||||||||
|---|---|---|---|---|---|---|---|---|---|---|
| Year | 2016 | 2017 | 2018 | 2019 | 2020 | 2021 | 2022 | 2023 | 2024 | 2025 |
| Number | 5,951 | 6,161 | 6,367 | 6,563 | 6,330 | 6,792 | 7,100 | 7,042 | 6,912 | 6,934 |
| % Change | 6% | 4% | 3% | 3% | -4% | 7% | 5% | -1% | -2% | 0.3% |
| Part-Time | ||||||||||
|---|---|---|---|---|---|---|---|---|---|---|
| Year | 2016 | 2017 | 2018 | 2019 | 2020 | 2021 | 2022 | 2023 | 2024 | 2025 |
| Number | 342 | 336 | 299 | 257 | 301 | 284 | 284 | 296 | 263 | 250 |
| % Change | -1% | -2% | -11% | -14% | 17% | -6% | 0% | 4% | -11% | -5% |
| Total Undergraduate Enrollment | ||||||||||
|---|---|---|---|---|---|---|---|---|---|---|
| Year | 2016 | 2017 | 2018 | 2019 | 2020 | 2021 | 2022 | 2023 | 2024 | 2025 |
| Number | 6,293 | 6,497 | 6,666 | 6,820 | 6,631 | 7,076 | 7,384 | 7,338 | 7,175 | 7,184 |
| % Change | 5% | 3% | 3% | 2% | -3% | 7% | 4% | -1% | -2% | 0.1% |
| Male | ||||||||||
|---|---|---|---|---|---|---|---|---|---|---|
| Year | 2016 | 2017 | 2018 | 2019 | 2020 | 2021 | 2022 | 2023 | 2024 | 2025 |
| Number | 2,305 | 2,291 | 2,329 | 2,392 | 2,267 | 2,463 | 2,480 | 2,513 | 2,521 | 2,529 |
| % of Total | 37% | 35% | 35% | 35% | 34% | 35% | 34% | 34% | 35.1% | 35.2% |
| Female | ||||||||||
|---|---|---|---|---|---|---|---|---|---|---|
| Year | 2016 | 2017 | 2018 | 2019 | 2020 | 2021 | 2022 | 2023 | 2024 | 2025 |
| Number | 3,988 | 4,206 | 4,337 | 4,428 | 4,364 | 4,613 | 4,900 | 4,822 | 4,653 | 4,654 |
|
% of Total |
63% | 65% | 65% | 65% | 66% | 65% | 66% | 66% | 64.9% | 64.8% |
| Unknown* | ||||||||||
|---|---|---|---|---|---|---|---|---|---|---|
| Year | 2016 | 2017 | 2018 | 2019 | 2020 | 2021 | 2022 | 2023 | 2024 | 2025 |
| Number | 4 | 3 | 1 | 1 | ||||||
| % of Total | 0%+ | 0%+ | 0.01% | 0.01% | ||||||
| Total Undergraduate Enrollment | ||||||||||
|---|---|---|---|---|---|---|---|---|---|---|
| Year | 2016 | 2017 | 2018 | 2019 | 2020 | 2021 | 2022 | 2023 | 2024 | 2025 |
| Number | 6,293 | 6,497 | 6,666 | 6,820 | 6,631 | 7,076 | 7,384 | 7,338 | 7,175 | 7,184 |
*Beginning with Fall 2022, IPEDS allows students to be reported as gender unknown.
Percentage of students for whom gender is unknown is 0.05% for Fall 2022 and 0.04% for Fall 2023
| US Non-Resident | ||||||||||
|---|---|---|---|---|---|---|---|---|---|---|
| Year | 2016 | 2017 | 2018 | 2019 | 2020 | 2021 | 2022 | 2023 | 2024 | 2025 |
| Number | 76 | 88 | 75 | 66 | 45 | 56 | 65 | 73 | 65 | 87 |
| % of Total | 1.2% | 1.4% | 1.1% | 1.0% | 0.7% | 0.8% | 0.9% | 1.0% | 0.9% | 1.2% |
| Hispanic | ||||||||||
|---|---|---|---|---|---|---|---|---|---|---|
| Year | 2016 | 2017 | 2018 | 2019 | 2020 | 2021 | 2022 | 2023 | 2024 | 2025 |
| Number | 311 | 347 | 385 | 434 | 458 | 534 | 619 | 698 | 753 | 837 |
| % of Total | 4.9% | 5.3% | 5.8% | 6.4% | 6.9% | 7.5% | 8.4% | 9.5% | 10.5% | 11.7% |
| Black or African American, non-Hispanic | ||||||||||
|---|---|---|---|---|---|---|---|---|---|---|
| Year | 2016 | 2017 | 2018 | 2019 | 2020 | 2021 | 2022 | 2023 | 2024 | 2025 |
| Number | 308 | 300 | 313 | 340 | 328 | 367 | 366 | 394 | 475 | 559 |
| % of Total | 4.9% | 4.6% | 4.7% | 5.0% | 4.9% | 5.2% | 5.0% | 5.4% | 6.6% | 7.8% |
| White, non-Hispanic | ||||||||||
|---|---|---|---|---|---|---|---|---|---|---|
| Year | 2016 | 2017 | 2018 | 2019 | 2020 | 2021 | 2022 | 2023 | 2024 | 2025 |
| Number | 5,025 | 5,218 | 5,352 | 5,436 | 5,253 | 5,558 | 5,695 | 5,488 | 5,151 | 4,947 |
| % of Total | 79.9% | 80.3 | 80.3% | 79.7% | 79.2% | 78.5% | 77.1% | 74.8% | 71.8% | 68.9% |
| American Indian of Alaska Native | ||||||||||
|---|---|---|---|---|---|---|---|---|---|---|
| Year | 2016 | 2017 | 2018 | 2019 | 2020 | 2021 | 2022 | 2023 | 2024 | 2025 |
| Number | 22 | 20 | 25 | 23 | 17 | 15 | 19 | 22 | 21 | 14 |
| % of Total | 0.3% | 0.3% | 0.4% | 0.3% | 0.3% | 0.2% | 0.3% | 0.3% | 0.3% | 0.2% |
| Asian, non-Hispanic | ||||||||||
|---|---|---|---|---|---|---|---|---|---|---|
| Year | 2016 | 2017 | 2018 | 2019 | 2020 | 2021 | 2022 | 2023 | 2024 | 2025 |
| Number | 147 | 146 | 134 | 140 | 155 | 171 | 212 | 244 | 243 | 268 |
| % of Total | 2.3% | 2.2% | 2.0% | 2.1% | 2.3% | 2.4% | 2.9% | 3.3% | 3.4% | 3.7% |
| Native Hawaiian or other Pacific Islander, non-Hispanic | ||||||||||
|---|---|---|---|---|---|---|---|---|---|---|
| Year | 2016 | 2017 | 2018 | 2019 | 2020 | 2021 | 2022 | 2023 | 2024 | 2025 |
| Number | 6 | 5 | 7 | 7 | 8 | 7 | 8 | 7 | 7 | 5 |
| % of Total | 0.1% | 0.1% | 0.1% | 0.1% | 0.1% | 0.1% | 0.1% | 0.1% | 0.1% | 0.1% |
| Two or more races, non-Hispanic | ||||||||||
|---|---|---|---|---|---|---|---|---|---|---|
| Year | 2016 | 2017 | 2018 | 2019 | 2020 | 2021 | 2022 | 2023 | 2024 | 2025 |
| Number | 220 | 238 | 258 | 289 | 271 | 292 | 317 | 324 | 361 | 358 |
| % of Total | 3.5% | 3.7% | 3.9% | 4.2% | 4.1% | 4.1% | 4.3% | 4.4% | 5.0% | 5.0% |
| Race and/or ethnicity unknown | ||||||||||
|---|---|---|---|---|---|---|---|---|---|---|
| Year | 2016 | 2017 | 2018 | 2019 | 2020 | 2021 | 2022 | 2023 | 2024 | 2025 |
| Number | 178 | 135 | 117 | 85 | 96 | 76 | 83 | 88 | 99 | 109 |
| % of Total | 2.8% | 2.1% | 1.8% | 1.2 | 1.4% | 1.1% | 1.1% | 1.2% | 1.4% | 1.5% |
| Total | ||||||||||
|---|---|---|---|---|---|---|---|---|---|---|
| Year | 2016 | 2017 | 2018 | 2019 | 2020 | 2021 | 2022 | 2023 | 2024 | 2025 |
| Total | 6,293 | 6,497 | 6,666 | 6,820 | 6,631 | 7,076 | 7,384 | 7,338 | 7,175 | 7,184 |
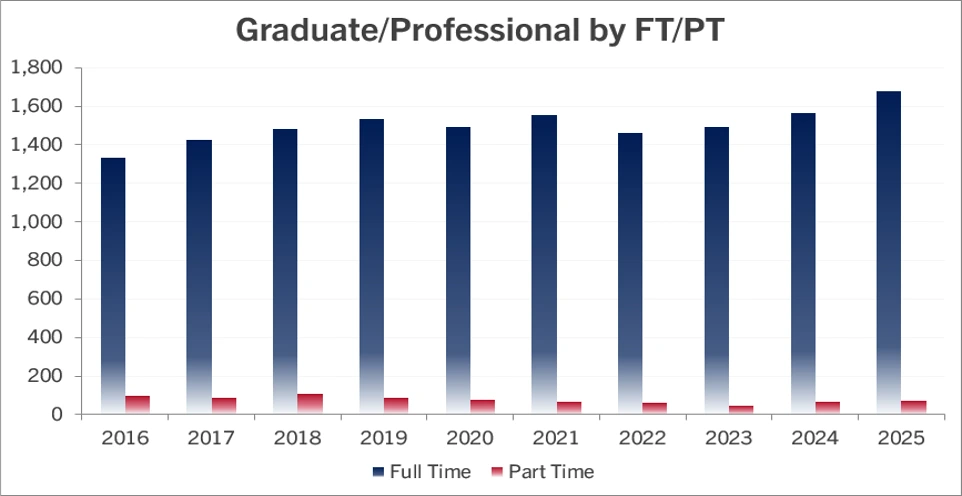
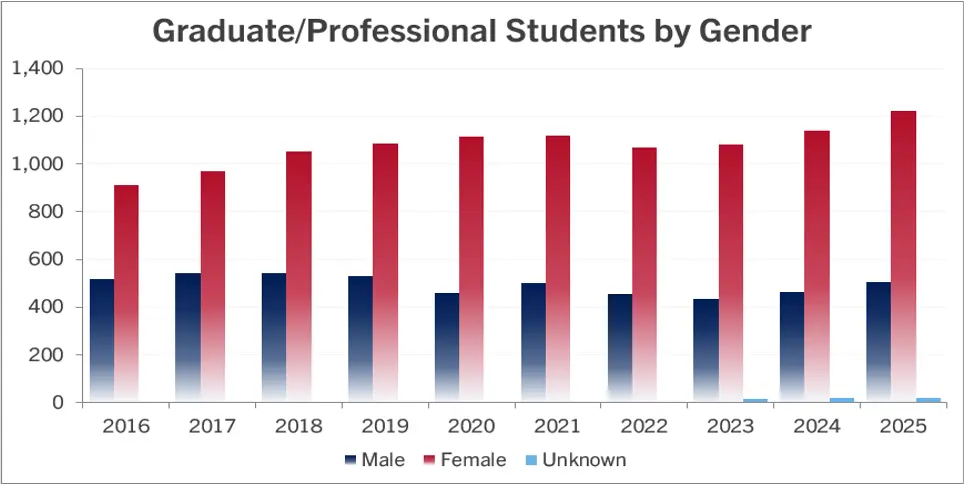
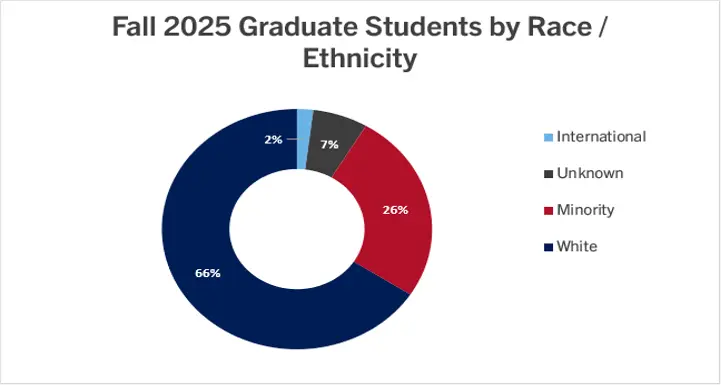
Graduate/Professional Enrollment
| Full-Time | ||||||||||
|---|---|---|---|---|---|---|---|---|---|---|
| Year | 2016 | 2017 | 2018 | 2019 | 2020 | 2021 | 2022 | 2023 | 2024 | 2025 |
| Number | 1,331 | 1,426 | 1,484 | 1,535 | 1,495 | 1553 | 1,462 | 1,490 | 1,563 | 1,678 |
| % Change | 7% | 7% | 4% | 4% | -3% | 4% | -6% | 2% | 5% | 7% |
| Part-Time | ||||||||||
|---|---|---|---|---|---|---|---|---|---|---|
| Year | 2016 | 2017 | 2018 | 2019 | 2020 | 2021 | 2022 | 2023 | 2024 | 2025 |
| Number | 99 | 89 | 110 | 85 | 78 | 67 | 64 | 44 | 65 | 70 |
| % Change | -20% | -10% | 24% | -23% | -8% | -14% | -4% | -31% | 48% | 8% |
| Total Enrollment | ||||||||||
|---|---|---|---|---|---|---|---|---|---|---|
| Year | 2016 | 2017 | 2018 | 2019 | 2020 | 2021 | 2022 | 2023 | 2024 | 2025 |
| Number | 1,430 | 1,515 | 1,594 | 1,620 | 1,573 | 1620 | 1,526 | 1,534 | 1,628 | 1,748 |
| % Change | 5% | 6% | 5% | 2% | -3% | 3% | -6% | 1% | 6% | 7% |
Note: Full-Time status => 6 credit hours
| Male | ||||||||||
|---|---|---|---|---|---|---|---|---|---|---|
| Year | 2016 | 2017 | 2018 | 2019 | 2020 | 2021 | 2022 | 2023 | 2024 | 2025 |
| Number | 520 | 545 | 541 | 532 | 460 | 502 | 455 | 434 | 466 | 504 |
| % of Total | 36% | 36% | 34% | 33% | 30% | 31% | 30% | 28.3% | 28.6% | 28.8% |
| Female | ||||||||||
|---|---|---|---|---|---|---|---|---|---|---|
| Year | 2016 | 2017 | 2018 | 2019 | 2020 | 2021 | 2022 | 2023 | 2024 | 2025 |
| Number | 910 | 970 | 1,053 | 1,088 | 1,113 | 1,118 | 1,068 | 1,082 | 1,141 | 1,222 |
| % of Total | 64% | 64% | 66% | 67% | 70% | 69% | 70% | 71% | 70% | 70% |
| Unknown | ||||||||||
|---|---|---|---|---|---|---|---|---|---|---|
| Year | 2016 | 2017 | 2018 | 2019 | 2020 | 2021 | 2022 | 2023 | 2024 | 2025 |
| Number | 3 | 18 | 21 | 22 | ||||||
| % of Total | 0.2% | 1.2% | 1.3% | 1.3% | ||||||
| Total Enrollment | ||||||||||
|---|---|---|---|---|---|---|---|---|---|---|
| Year | 2016 | 2017 | 2018 | 2019 | 2020 | 2021 | 2022 | 2023 | 2024 | 2025 |
| Number | 1,430 | 1,515 | 1,594 | 1,620 | 1,573 | 1,620 | 1,526 | 1,534 | 1,628 | 1,748 |
*Beginning with Fall 2022, IPEDS allows students to be reported as gender unknown.
| US Non-Resident | ||||||||||
|---|---|---|---|---|---|---|---|---|---|---|
| Year | 2016 | 2017 | 2018 | 2019 | 2020 | 2021 | 2022 | 2023 | 2024 | 2025 |
| Number | 18 | 20 | 24 | 18 | 14 | 18 | 19 | 21 | 29 | 34 |
| % of Total | 1.3% | 1.3% | 1.5% | 1.1% | 0.9% | 1.1% | 1.2% | 1.4% | 1.8% | 1.9% |
| Hispanic | ||||||||||
|---|---|---|---|---|---|---|---|---|---|---|
| Year | 2016 | 2017 | 2018 | 2019 | 2020 | 2021 | 2022 | 2023 | 2024 | 2025 |
| Number | 30 | 42 | 65 | 63 | 78 | 82 | 97 | 99 | 108 | 107 |
| % of Total | 2.1% | 2.8% | 4.1% | 3.9% | 5.0% | 5.1% | 6.4% | 6.5% | 6.6% | 6.1% |
| Black or African American, non-Hispanic | ||||||||||
|---|---|---|---|---|---|---|---|---|---|---|
| Year | 2016 | 2017 | 2018 | 2019 | 2020 | 2021 | 2022 | 2023 | 2024 | 2025 |
| Number | 75 | 117 | 116 | 116 | 105 | 114 | 112 | 116 | 104 | 117 |
| % of Total | 5.2% | 7.7% | 7.3% | 7.2% | 6.7% | 7.0% | 7.3% | 7.6% | 6.4% | 6.7% |
| White, non-Hispanic | ||||||||||
|---|---|---|---|---|---|---|---|---|---|---|
| Year | 2016 | 2017 | 2018 | 2019 | 2020 | 2021 | 2022 | 2023 | 2024 | 2025 |
| Number | 1,057 | 1,167 | 1,229 | 1,271 | 1,223 | 1,250 | 1,153 | 1,157 | 1,198 | 1,151 |
| % of Total | 73.9% | 77.0% | 77.1% | 78.4% | 77.7% | 77.2% | 75.6% | 75.4% | 73.6% | 65.8% |
| American Indian or Alaska Native | ||||||||||
|---|---|---|---|---|---|---|---|---|---|---|
| Year | 2016 | 2017 | 2018 | 2019 | 2020 | 2021 | 2022 | 2023 | 2024 | 2025 |
| Number | 0 | 0 | 1 | 2 | 4 | 4 | 3 | 4 | 6 | 2 |
| % of Total | 0.0% | 0.0% | 0.1% | 0.1% | 0.3% | 0.2% | 0.2% | 0.3% | 0.4% | 0.1% |
| Asian, non-Hispanic | ||||||||||
|---|---|---|---|---|---|---|---|---|---|---|
| Year | 2016 | 2017 | 2018 | 2019 | 2020 | 2021 | 2022 | 2023 | 2024 | 2025 |
| Number | 90 | 67 | 67 | 67 | 68 | 60 | 55 | 44 | 55 | 67 |
| % of Total | 6.3% | 4.4% | 4.2% | 4.1% | 4.3% | 3.7% | 3.6% | 2.9% | 3.4% | 3.8% |
| Native Hawaiian or other Pacific Islander, non-Hispanic | ||||||||||
|---|---|---|---|---|---|---|---|---|---|---|
| Year | 2016 | 2017 | 2018 | 2019 | 2020 | 2021 | 2022 | 2023 | 2024 | 2025 |
| Number | 1 | 1 | 1 | 1 | 1 | 1 | 0 | 1 | 1 | 1 |
| % of Total | 0.1% | 0.1% | 0.1% | 0.1% | 0.1% | 0.1% | 0.0% | 0.1% | 0.1% | 0.1% |
| Two or more races, non-Hispanic | ||||||||||
|---|---|---|---|---|---|---|---|---|---|---|
| Year | 2016 | 2017 | 2018 | 2019 | 2020 | 2021 | 2022 | 2023 | 2024 | 2025 |
| Number | 27 | 37 | 42 | 41 | 38 | 55 | 54 | 56 | 92 | 154 |
| % of Total | 1.9% | 2.4% | 2.6% | 2.5% | 2.4% | 3.4% | 3.5% | 3.7% | 5.7% | 8.8% |
| Race and/or ethnicity unknown | ||||||||||
|---|---|---|---|---|---|---|---|---|---|---|
| Year | 2016 | 2017 | 2018 | 2019 | 2020 | 2021 | 2022 | 2023 | 2024 | 2025 |
| Number | 132 | 64 | 49 | 41 | 42 | 36 | 33 | 36 | 35 | 115 |
| % of Total | 9.2% | 4.2% | 3.1% | 2.5% | 2.7% | 2.2% | 2.2% | 2.3% | 2.1% | 6.6% |
| Total | ||||||||||
|---|---|---|---|---|---|---|---|---|---|---|
| Year | 2016 | 2017 | 2018 | 2019 | 2020 | 2021 | 2022 | 2023 | 2024 | 2025 |
| Total | 1,430 | 1,515 | 1,594 | 1,620 | 1,573 | 1,620 | 1,526 | 1,534 | 1,628 | 1,748 |
Top 20 Majors 2025
| Major | Students |
|---|---|
| Music Business | 978 |
| Nursing | 604 |
| Audio Engineering Technology | 462 |
| Commercial Music | 330 |
| Songwriting | 305 |
| Biology | 303 |
| Media & Entertainment Industries | 240 |
| Business Administration | 234 |
| Psychological Science | 188 |
| Motion Picture Production | 172 |
| Architecture | 164 |
| Legal Studies | 141 |
| Exercise Science | 131 |
| Finance | 122 |
| Marketing | 118 |
| Interior Design | 99 |
| Accounting | 89 |
| Computer Science | 85 |
| Neuroscience | 76 |
| Theatre Performance | 74 |
| Major | Students |
|---|---|
| Law | 372 |
| Pharmacy | 212 |
| Physical Therapy | 173 |
| Occupational Therapy | 147 |
| Medicine | 103 |
| Mental Health Counseling | 95 |
| Sport Administration | 71 |
| Professional MBA | 67 |
| Occupational Therapy-weekend program | 58 |
| Nursing | 51 |
| Media and Entertainment | 51 |
| Strategic Leadership in Educ | 45 |
| MBA - Accelerated | 44 |
| Master of Arts in Teaching | 44 |
| Audio Engineering | 33 |
| Applied Analytics | 26 |
| Accounting | 25 |
| Health Care Management | 17 |
| Strategic Comm & Leadership | 17 |
| Commercial Music | 17 |
*Enrollment headcounts on this page include audit-only students, and may therefore differ from enrollment headcounts reported to external organizations such as IPEDS or the CDS.